How to read the traffic graphs
See what your server sends and receives. Traffic is unmetered, so the graphs are for your information only.
- Where
- Servers → your server → Traffic
- Periods
- day, month, year
- Updated
- about every 15 minutes
Open the graph
Open the server and scroll to Traffic. Switch between Day (per hour), Month (per day) and Year (per month) (1). Use the arrows to go back to earlier periods.
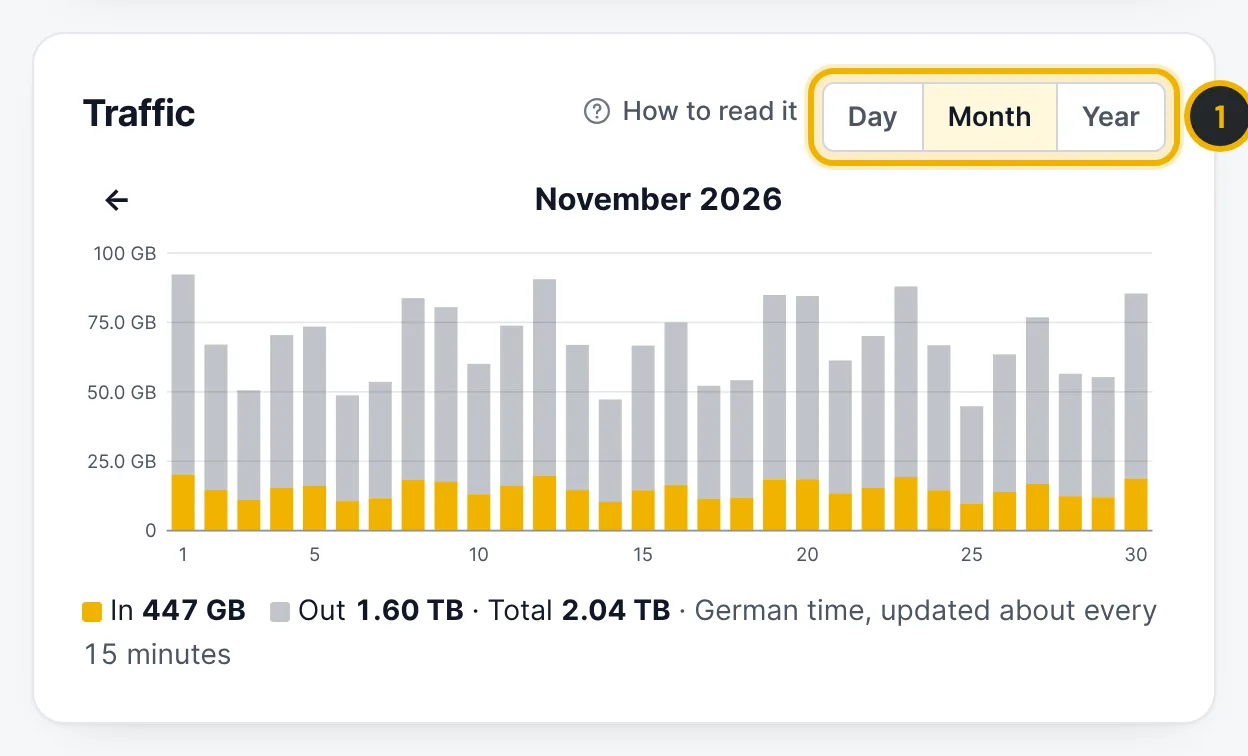
The numbers in the picture match the numbers in the text. Read the numbers
In (yellow) is traffic your server receives, Out (grey) is what it sends. The line below the graph shows the totals for the period. Times are German time, like the data centre. The graph counts the main IPv4, your extra IPv4 addresses and the IPv6 /64.
Questions
Is there a traffic limit?
No. The 1 Gbit/s port is unmetered. Only optional 10 Gbit/s uplinks are billed by volume.
Related guides
Still stuck?
Our team answers around the clock. Most questions get an answer within the hour.